Introduction
In the ever-evolving landscape of cryptocurrency, understanding support levels is crucial for traders and investors alike. Recently, analyst Ali Martinez has shed light on Solana's potential support levels based on a Parallel Channel observed in its weekly price chart. This analysis provides valuable insights into where the asset may find stability in the face of market fluctuations.
Understanding Parallel Channels
A Parallel Channel is a technical analysis pattern that forms when an asset trades between two parallel trendlines. These channels can be categorized based on their orientation: ascending, descending, or horizontal. In Solana's case, the focus is on a horizontal channel, indicating a phase of sideways price action.
The significance of these channels lies in their ability to delineate potential support and resistance levels, which traders can use to make informed decisions. As Solana has been navigating this channel, the implications for its price movements are substantial.
Current Price Action and Support Levels
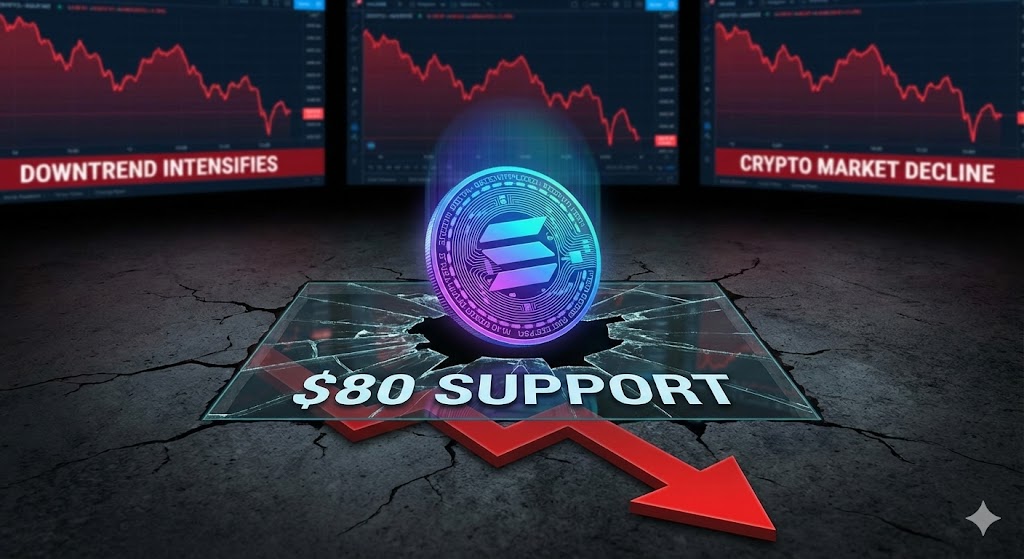
As of now, Solana is trading at approximately $81, having experienced a 5.5% decline in the last 24 hours. The analyst has identified three key support levels: $50.22, $22.47, and $9.98. These levels correspond to points 50%, 75%, and 100% down the channel, respectively. Historically, these levels have acted as significant points of interest during previous market cycles.

During the last bear market, Solana tested the lowest support level, which helped establish a bottom for the asset. The current market sentiment suggests that if the downward momentum continues, these levels could be revisited, making it essential for traders to stay vigilant.
Market Sentiment and Broader Implications
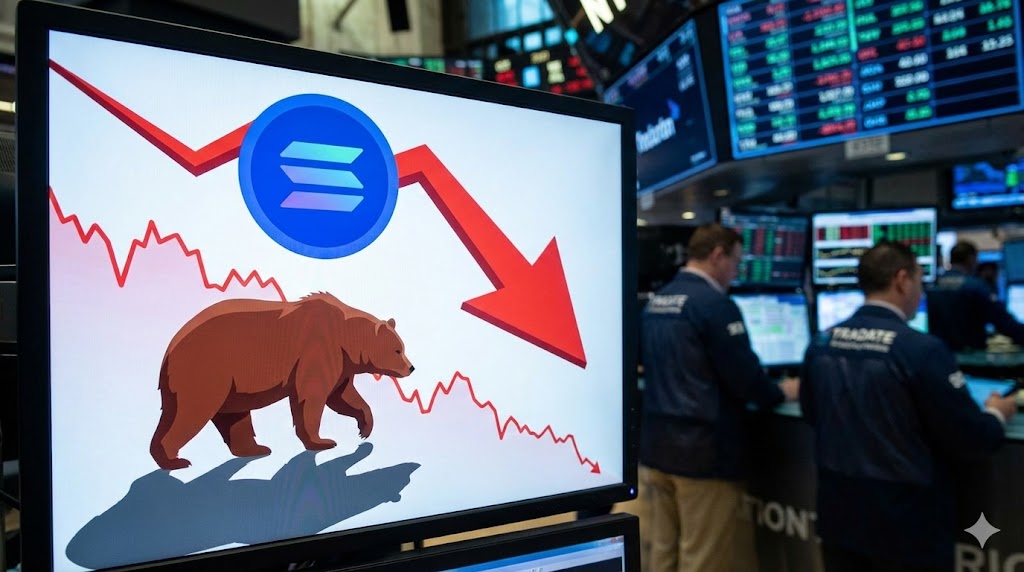
The cryptocurrency market as a whole has been experiencing a bearish shift, impacting various assets, including Solana. The recent price movements indicate a struggle to maintain levels above $85, with traders closely monitoring the situation. The broader market dynamics, including Bitcoin's price recovery, play a significant role in influencing Solana's trajectory.
As the market evolves, it is crucial to consider external factors such as regulatory developments, technological advancements, and overall market sentiment. These elements can significantly impact Solana's price movements and the effectiveness of the identified support levels.
Key Takeaways
- Solana's potential support levels are identified at $50.22, $22.47, and $9.98.
- A Parallel Channel pattern indicates sideways price action.
- Current market sentiment is bearish, affecting Solana's price.
- Historical support levels have previously helped establish price bottoms.
- Traders should remain vigilant as market conditions evolve.
FAQ
What are support levels in cryptocurrency trading?
Support levels are price points where an asset tends to stop falling and may bounce back. They act as a safety net for traders.
How does a Parallel Channel affect price predictions?
A Parallel Channel helps traders identify potential support and resistance levels, allowing for better-informed trading decisions.
Why is Solana's price declining?
Solana's price decline is influenced by broader market trends and bearish sentiment across the cryptocurrency sector.
Sources
For more information, visit the original article at NewsBTC.