

Introduction
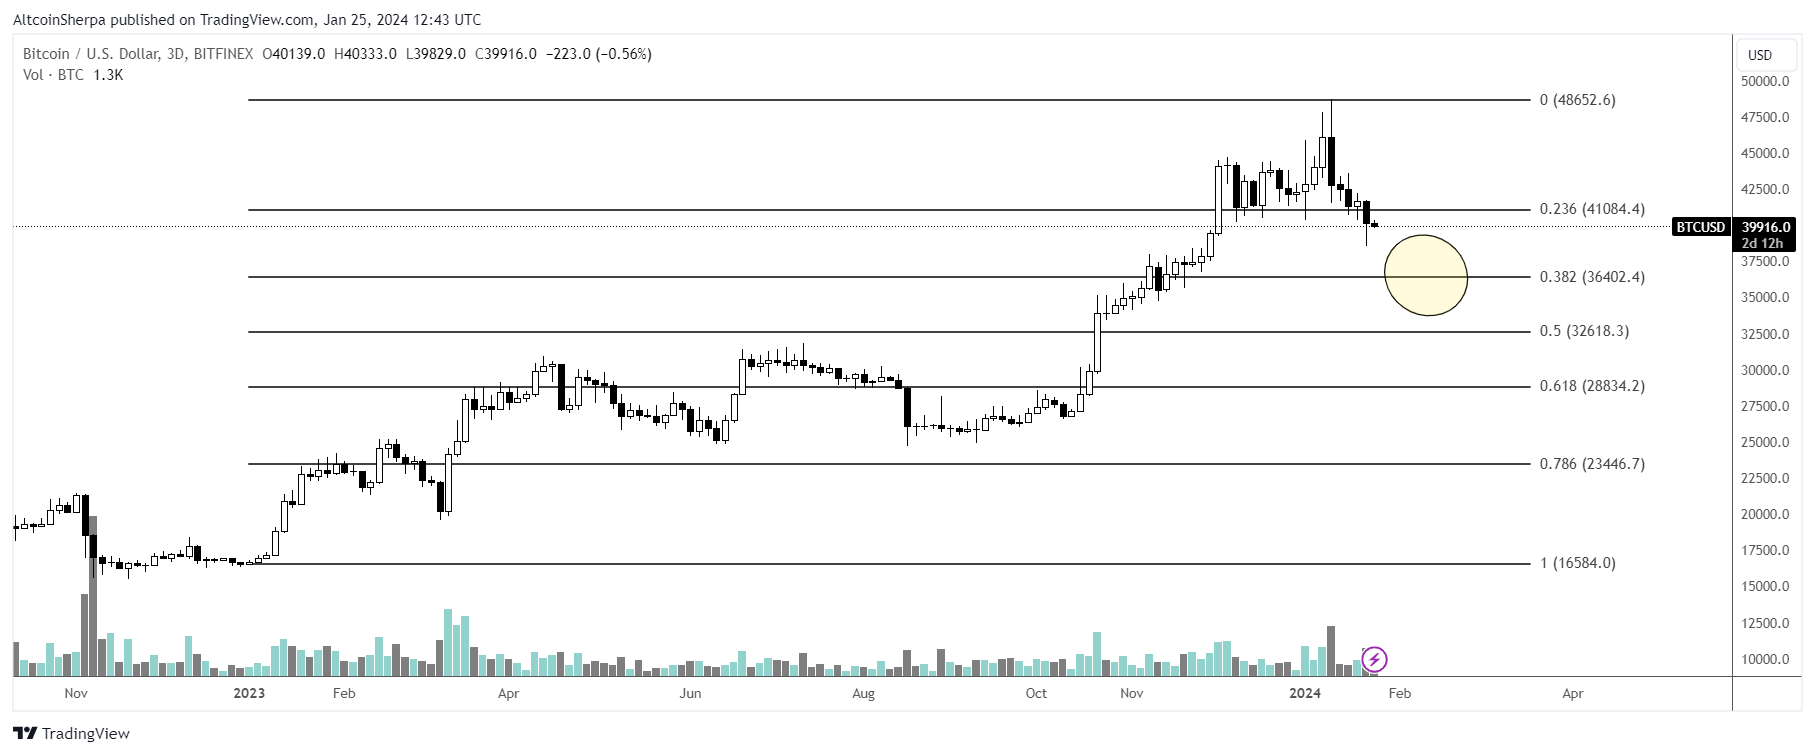
The cryptocurrency market is notorious for its volatility, and Bitcoin, the leading digital currency, is currently navigating a challenging bear trend. According to a recent analysis, Bitcoin may be poised for a significant decline, potentially dropping below the $40,000 mark. This article delves into the insights provided by crypto analyst Crypto Bullet, who has mapped out the current market dynamics using a wave structure analysis.
Current Market Analysis
Crypto Bullet has outlined a bearish forecast for Bitcoin, suggesting that the cryptocurrency has not yet reached its cycle bottom. Instead, he anticipates a final surge before a major downturn. His analysis, presented on social media platform X, indicates that Bitcoin's price action has formed a “Double ZigZag (WXY)” pattern, which he believes will guide future price movements.
Understanding the Wave Structure
According to Crypto Bullet, the prolonged consolidation phase between $62,000 and $78,000 is indicative of a broader bearish structure. This contrasts sharply with the previous trading range of $84,000 to $97,000, where Bitcoin spent less time. The current market behavior suggests that the cryptocurrency is still in a corrective phase rather than a recovery.

Crypto Bullet anticipates that Bitcoin will make one final push towards $85,000, which he identifies as a significant resistance level. This level is above his ABC target of $82,500, as illustrated in his chart. The expectation is that this upward movement is part of a larger corrective wave rather than the end of the bear market.
The Potential Downturn
Looking ahead, Crypto Bullet predicts that Bitcoin's wave Y could represent the most severe downturn of this cycle. He estimates that once Bitcoin completes its rebound above $80,000, a sharp market reversal could occur, leading to a rapid price decline towards the projected bottom of $40,000. This scenario suggests a potential 50% drop from the $80,000 level, which could significantly impact bullish traders who may misinterpret the surge as the beginning of a new bullish trend.
Timing the Market
In terms of timing, Crypto Bullet believes that the bear market could extend for another five months, aligning closely with historical bear cycles. This timeline suggests that the anticipated drop to $40,000 may occur between September and October 2026. Such projections highlight the importance of careful market analysis and the need for traders to remain vigilant amidst the volatility.
- Bitcoin remains in a bear trend.
- Potential surge towards $85,000 before a downturn.
- Wave structure analysis indicates further declines.
- Projected bottom at $40,000.
FAQ
What is the current price trend of Bitcoin?
Bitcoin is currently experiencing a bearish trend, with analysts predicting further declines in the coming months.
What does the wave structure analysis indicate?
The wave structure analysis suggests that Bitcoin may see a final surge before a significant downturn, potentially dropping below $40,000.
When is the expected bottom for Bitcoin?
Analysts predict that Bitcoin could reach its bottom around $40,000 between September and October 2026.
Sources
For further insights, you can refer to the original article on NewsBTC and other reputable sources like CoinMarketCap and CoinGecko.