
Introduction
The cryptocurrency market is known for its volatility, and Bitcoin (BTC) is no exception. Recently, Bitcoin experienced a sharp decline from well above $73,000, entering a consolidation phase around the $70,000 mark. This article will explore the current state of Bitcoin's price, potential resistance and support levels, and what traders can expect moving forward.
Current Market Overview
Bitcoin's price has been fluctuating significantly, with the bears pushing it below critical levels of $72,500 and $72,000. This has led to a bearish sentiment in the market, as traders closely monitor the price movements. The most recent low was formed at $68,782, and since then, Bitcoin has been consolidating its losses, showing signs of a minor upward move above $70,000.
Key Resistance and Support Levels
As Bitcoin trades below $72,000 and the 100 hourly simple moving average, it faces immediate resistance near the $70,800 level. The first key resistance is around $71,500, where a bearish trend line is forming. A close above this level could signal a potential upward trend, pushing the price towards the $72,400 resistance or even the $73,250 level.
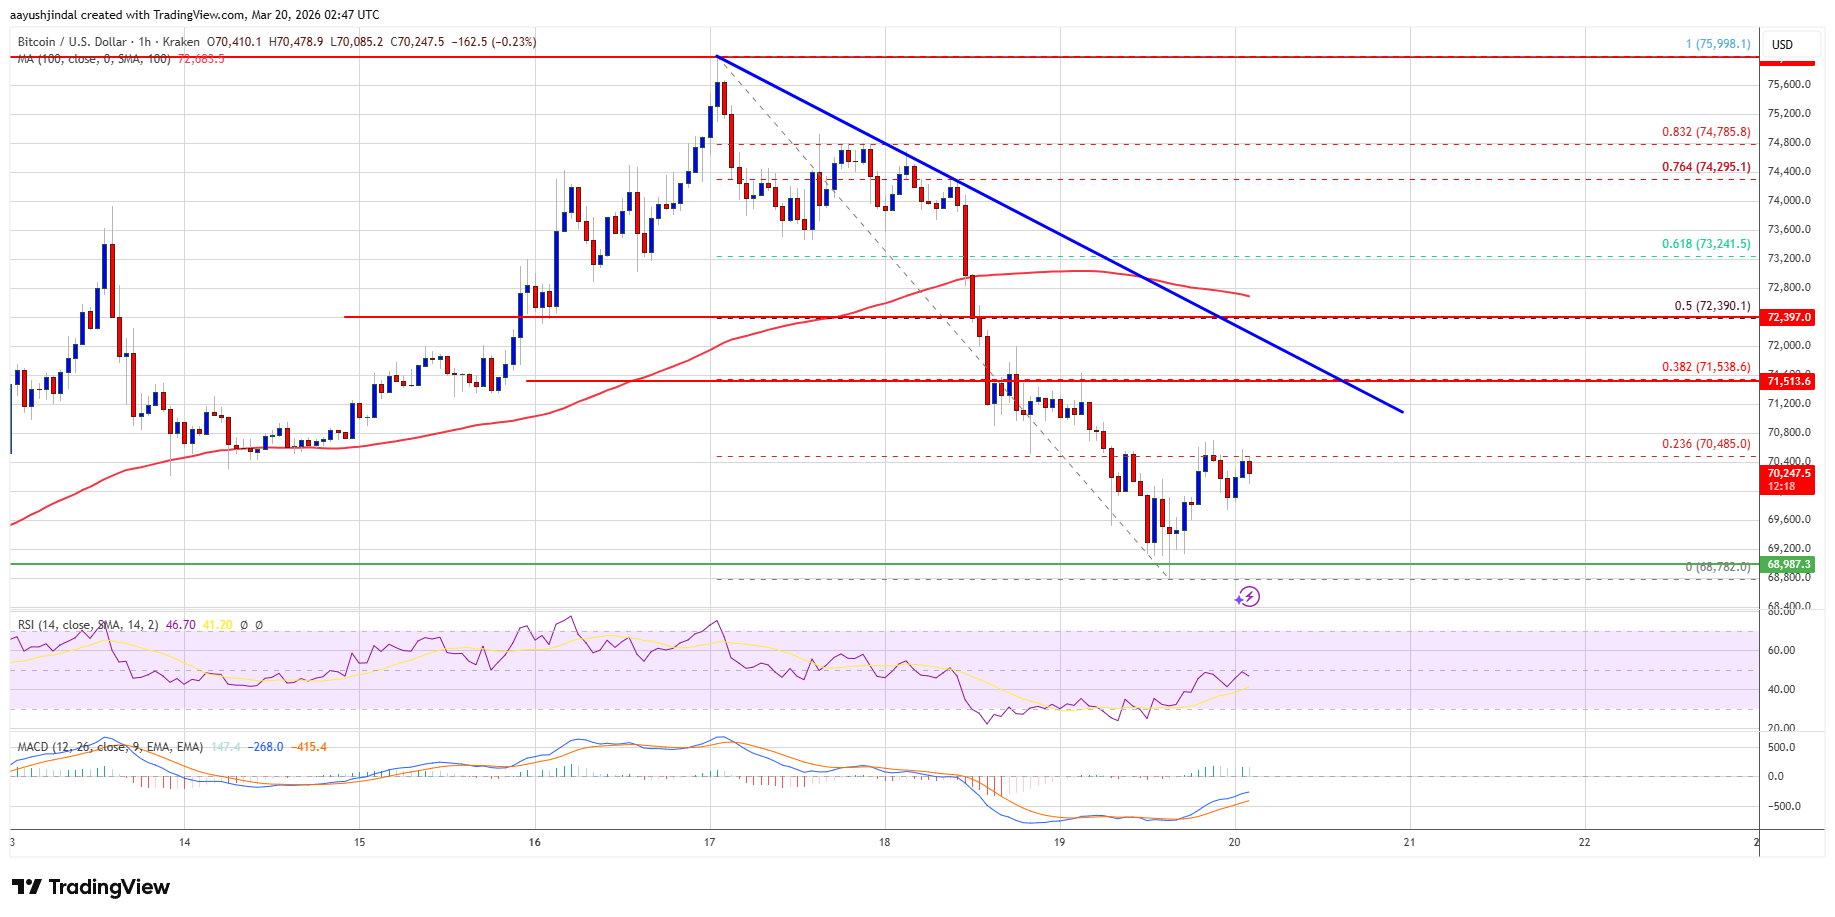
Conversely, if Bitcoin fails to break above the $72,400 resistance zone, it may begin another decline. Immediate support is near the $69,650 level, with major support at $69,000 and further down at $68,800. A breakdown below these levels could lead to a significant drop towards the $68,000 support in the near term.
Technical Indicators
The Relative Strength Index (RSI) for BTC/USD is currently below the 50 level, indicating a bearish trend. Traders should keep an eye on this indicator as it could provide insights into potential price reversals or continuations. Additionally, volume trends will play a crucial role in determining the strength of any forthcoming movements.
Key Takeaways
- Bitcoin has seen a significant decline from above $73,000.
- Current consolidation is occurring around the $70,000 mark.
- Immediate resistance is at $70,800 and $71,500.
- Support levels are critical at $69,000 and $68,800.
- RSI indicates a bearish trend below the 50 level.
FAQ
What caused the recent decline in Bitcoin's price?
The decline was primarily driven by bearish market sentiment and profit-taking from traders after reaching highs above $73,000.
What are the key resistance levels for Bitcoin?
Key resistance levels include $70,800 and $71,500, with a significant level at $72,400.
How can traders prepare for potential price movements?
Traders should monitor support and resistance levels closely, utilize technical indicators like RSI, and stay informed about market news and trends.
Sources
For more detailed analysis, visit the original article at NewsBTC. Additionally, check out resources from CoinMarketCap and CoinGecko for market insights.